
How to Read a Nautical Chart
A chart is not a map. A map just shows you how to get from point A to point B through roads. A nautical chart, however, is filled with information and it's a phenomenal navigational tool.
This video is about a couple of small, basic points on how to read a nautical chart. Just some stuff that when you have a chart in front of you, you'd at least know what you're looking at. A chart is not a map. A map just shows you how to get from point A to point B through roads. A chart is just filled with information and it's a navigational tool. You're going to use it not only to plan your trip, but you will also know where to go, where not to go, when to go. You're just going to know so much more information about what's around you and it's always changing. You need to update your charts.
So these are the topics I quickly want to go through, depths, buoys, hazards, latitude and longitude, distances, the compass rose, and magnetic versus true north. So let's start with depths. The numbers in the water represent the depth. Now, the U.S. NOAA uses mean lower low water, which is the average height of the lowest tide recording at a tide station each day during a recorded period. So these numbers are pretty accurate to what the depth is going to be at low tide. However, you will have instances where it could be a little bit lower. So just account for that.
Then, you can tell that there are some areas depicted by darker brown that is outside of the edges. These are sandbars that might actually show up at low tides. So these are things to watch out for. If you're planning your trip and you want to get somewhere, there's a chance a sandbar might cut your path. So depending on the time of day and depending on what the tides are doing, you can plan accordingly.
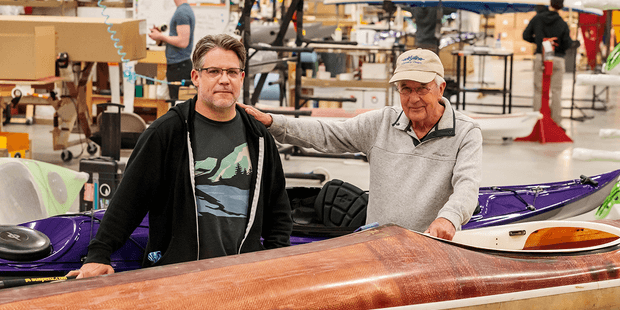
50 years of lightweight, maneuverable, high-performing kayaks.
Check out this interview with Tom Keane, Eddyline Kayaks Co-Owner, on their journey!
Now, let's talk about buoys. You have green buoys. You have red buoys. If you notice, these buoys here depict this channel is the deepest part of this little bay. So boaters know where to go, and they know how to stay safe even during low tides. Now, green buoys are usually called "cans" because they look like cylinders. Red buoys are called "nuns". They look like a triangle. The way they'll depict these buoys, they'll say, "Green Can #7. Green Can #5." So if you're out on the water and you have the chart in front of you, you're seeing a green can labeled #3, you'll know exactly what you're looking at. The same goes for "Red Nun #8. Red Nun #6."
Usually, the numbers increase as you get closer to port and vice versa. They decrease as you get out to see. Now, a good rule of thumb and a good thing for you to remember is red, right, return. Boats returning to harbor will keep the red nuns to their right. If a boat is returning to harbor over here, they will be keeping the red buoys to their right, and they will be keeping the green buoys to their left. But just remembering that they will be keeping the buoys to the right is enough to know where the channel is. So if you're out on the water and you see two red buoys, and you know where the harbor is, you will know, even if you don't see the green cans, where the channel is. Red, right, return.
Other information is also used to show you markers and buoys. This marker is depicted here as a flashing red light every 4 seconds, 26 feet up in the air, and can be seen for 5 miles, and it's marker #8. Now, this one over here we'll see as a flashing green light every 2.5 seconds. It is 61 feet up in the air and can be seen for 7 miles, and this I would estimate is a lighthouse, which indeed it is. So some markers will also have sound to them. Here, Red 24 will flash red every 2.5 seconds, but will also have a bell. So at times with low visibility, you can go by the sound and know that the buoy is there.
Hazards. The tides are always changing. At high tide, things that could be dangerous to you might be hiding underwater. So it's very good to know where they are ahead of time. Not only because they might be dangerous and you could run into them, but also they could be affecting the way current is moving around certain areas. So for example, here we see all these rock formations. They might be hidden during high tide. But having the chart, you would know exactly where they are.
So we usually use coordinates to know where we are on the globe. We use latitude and longitude. Latitude, very quickly, divides the Earth from top to bottom in horizontal, parallel lines. They start at the equator. That represents zero degrees, and it reaches the poles at 90 degrees at north and south. Now, longitude are lines that connect the two poles. Zero degrees is depicted at Greenwich, England, and they go east and west and meet on the other side at 180 degrees. Each degree is broken into 60 minutes, and then each minute into 60 seconds. With those smaller numbers, you can get tighter and tighter on the spot so that you can give a more accurate location.
Every chart will give you a scale so that you know what you're looking at. There is one nautical mile. What they also do, this is half a mile, and then they break it down even further so that then, depending on whatever instrument you have with you, you can take that information and take it elsewhere. A compass rose will show you true north, that way you'll know the other orientations and you can translate this rose to anywhere on this chart.
So magnetic and true north are not in the same place. Actually, magnetic north changes ever so slightly as time passes. So every rose will also have a magnetic rose inside so that when you're using a compass, when you get a reading, it'll actually be pointing to magnetic north. Then, you can adjust if you want to and use true north, which will be on the chart. Now, the magnetic rose will also show you how much of variation there is, how much of a difference between true north and magnetic north there is. It also will show you how much it increases or it decreases each year.
So when you're using a chart, see how old it is. Because in some areas it might not make that much of a difference, but in others it could really affect your calculations and throw off all of your work. So charts are extremely useful. You can get waterproof charts that you can fold up. They last a long time. They can take a beating, and you can keep them on your deck [bungies]. You could also download charts yourself online, print them out, and then use some kind of waterproof container to keep them on your deck.
Related Articles
Even if you do your research and check the weather before heading out, sooner or later every kayak…
When a situation occurs while paddling in a group, conditions don't stop. Learn some pointers on how to…
Dungeness Spit from above, with the New Dungeness Lighthouse in the distance Dungeness…

A discussion on the use of a compass from a kayaking standpoint begins with basic compass savvy and then…