
Tide Charts
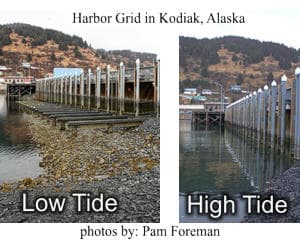
My first encounter with tides came one afternoon in Alaska. We entered a bay in our kayaks and sought out a gradually-sloped sandy section of beach with a few clumps of driftwood scattered throughout the area. We took our bowlines and tied off on a spike of sand-polished, gray wood sticking out of the sand. We returned several hours later to see our boats lying on shore like basking sea lions – a good 50 yards from the water!
Just recently a newspaper carried a story about two kayakers out east who were rescued from the mud flats of a bay where the outgoing tide left them in the middle of peanut buttery mud over 200 yards from shore. Darkness and dropping temperatures made their situation life threatening.
In both cases, attention had not been paid to the affects tides have on our ocean waterways. Tides are an everyday occurrence along all coastal areas. In North America tides fluctuate greatly, from extremes in Alaska in the west and Nova Scotia in the east (45' difference in the Bay of Fundy, for example) to barely noticeable differences out to sea.
Knowing what causes tides and their dynamics is key to safely paddling ocean byways and using tide information to aid in navigation. Following is a primer on basic tidal dynamics and how this info’ can help one use this water movement info to safely and knowledgeably paddle our ocean waters.
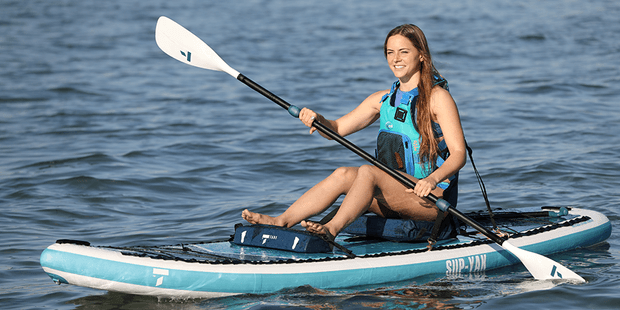
TAHE 10'6 & 11'6 SUP-YAK Inflatables
2-in-1 Kayak & Paddle Board complete packages for single or tandem use.
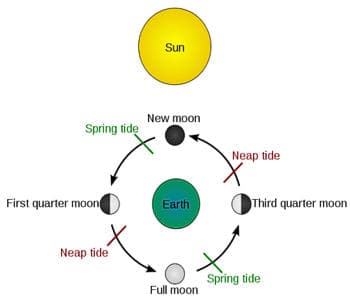
Basically, tides are caused by the gravitational affects of the moon and sun on the water masses of the earth. Considering the earth as a perfect sphere and the oceans as a mass of fluid surrounding it, that mass of water is pulled by gravity depending on the position of the moon and the sun. When the moon and the sun are aligned with the earth, the affect is called a "spring" tide. When the moon is at right angles to the line between the earth and the sun, a "neap" is formed. While the sun has 27 million times the mass of the moon, it is 390 times farther away from earth. This means that the moon's gravitational forces on earth are twice that of the sun. Those affects are most noticeable along ocean shorelines around the world.
Those gravitational forces create water movement called "tides" and they vary from high to low – the "tidal range" – that determine the depth of water in any one spot throughout the day. This tidal range typically changes twice a day. The catch is that it's based on a "lunar" day which is fifty minutes longer than a "solar" or sun day, our normal 24-hour rotation. That means that tidal changes (slack high and slack low) occur on a 24 hour, 50 minute cycle. Each period of tides, therefore is six hours, 12.5 minutes each.
The fundamental dynamics of tides are explained in an ideal world with no variables .In reality, tides are influenced by geological differences in the shape of the globe itself and the unique characteristics of the ocean floor and coastline dynamics. A narrowing inlet can increase the speed of the tidal currents that are formed and a shallow bay can mean water recedes thousands of yards from the average shoreline. Winds can also affect the amount of water that might pile up on shore during an incoming tide. All these variable affect the ultimate affect tides can have on a given area.
A few terms worth knowing when understanding tidal influences include:
- TIDAL CURRENT - the horizontal movement of tides;
- FLOOD – the incoming tide, culminating in a "high" tide
- EBB – the outgoing tide, culminating in a "low" tide
- SLACK – the time between the high/low or low/high tide
- SEMI-DIURNAL TIDES: two highs and two lows per day (most common)
- DIURNAL: Only one high and one low per day (Gulf of Mexico)
- MIXED TIDE: Variable highs and lows (Pacific Ocean and some Pacific islands)
- ZERO TIDE HEIGHT – the standard tide height from which all others are measured.
Imagine a baseline tide level. Tides near or at the baseline are low, those that peak above the baseline are high. Those extreme tides that dip or peak beyond that baseline are designated as "low low" or "high high" respectively. The difference in depth between the maximum low and the ultimate high is called the "tide range".
Imagine a low tide of -1.5 feet. The high tide is 6.7 feet. The tide range therefore is the summation of both values: -1.5' + 6.7'= 8.2' total water depth. These values are expressed in tide tables that are published for specific regions throughout coastal areas of most parts of the world.
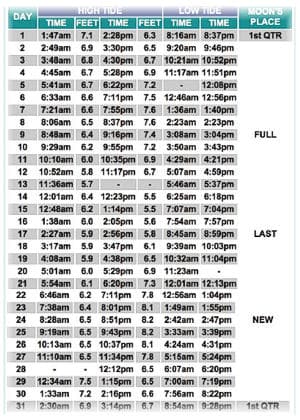
TIDE TABLES AND NAUTICAL CHARTS
Tidal tables reveal the tidal ranges by expressing the relationship of high and low tides to the 24 hour solar day. To help determine a more exacting tidal affect, the tide tables also include time variations of tidal changes against the time and location expressed in the chart (some areas are affected several minutes or even an hour or more after the designated tide change due to geographical and other local anomalies).
THE RULE OF TWELVES:
Since tides fluctuate over a period of six plus hours, you can determine what percentage of the tidal flow has passed using the "Rule of Twelves". The range of tides is divided into 1/12th units. During the first hour 1/12 of the tide changes. During the second hour 2/12th have moved. Continuing the progression, the third hour moves 3/12th, fourth hour 3/12 again, and back down to 1/12 by the sixth hour in the high-low/low-high cycle.
Let's say the low time is 2' above the chart datum level (base line). Given a high tide of 14' means that 12' of water (14'-2'=12') will be moving. During the first hour, 1/12 of that water depth (1') will change. During the second hour, 2/12 or 2' has moved. By the third hour, or 3/12, 3' has moved. This equals 6' of water during the first half of the tidal range. Since the low tide was already 2.0' above the base line, the total depth at a certain locations will be 6' + 2' or 8' of water. Using this information will aid one in reading and using the data on the local tide table that only expresses the final figures, not the interim ones.
RULE OF SEVENS:
Another factor in determining the actual tide changes is due to the shift in the moon from spring to neap tide. That happens over a period of seven days. This is a linear change so basically each day alters the shift by 1/7. Therefore the change in daily range is spring – neap/7.
FACTORS ASSOCIATED WITH TIDES:
While the tide charts will give you an indication of water depth at a range of locations on a nautical chart, other factors will affect if there are any other navigational concerns one should consider.
Deeper water means tidal currents will be faster. Bays and waterways that narrow down will cause water to run faster (a waterway width restricted by 50 percent will generate twice the speed of the current). A tidal current heading up into a bay can form back eddies on the downstream side of a point or protrusion out from the coastline. This eddy tends to circulate towards the shore.
It is critically important, and a major safety issue, to always use a nautical chart when determining routes based on tides. A topographic map does not include subsurface water characteristics that directly affect how local waters are influenced by tides.
Case in point. Several years ago a group of kayakers in Prince William Sound in Alaska decided to evacuate an area due to an approaching or existing storm. They had the option of taking a western or eastern channel around an island along their route. The western route was significantly shorter than the other. They opted to take the shorter, presumably time-saving route. Three of the four members of the party drowned as a result of taking that route.
Sadly they had referred to a topo' map that showed no underwater characteristics of the area. The topo had not shown a major shoal that stretched across the channel at the far end of the island. This created rough, high waves caused by currents from the incoming tide being forced up against strong approaching headwinds. The kayakers were caught in dangerous waves beyond their abilities. Pertinent tidal information will be included on a nautical chart.
TIDAL ZONES:
While technical information is available on a tidal chart, visual observation can usually indicate where the tide is in a cycle. There are three basic tidal zones: high, medium, low. Obvious signs of tidal range are the bands of color on rocks along shore. Other ways to know where the tide is is to check out the exposed life clinging to those rocks.
Barnacles, crabs, limpets and snails are among those critters that exist in the high tide range, they are always exposed to light and air. Anemones are most common in the middle range while chitons, mussels and sea urchins survive in the low tidal zone.
At some beaches with gradual slopes, you can determine whether the tide is rising or falling simply by placing a marker (stick in the sand or a stone or shell) and watching whether the surf line of water advances beyond the mark or recedes seaward from it.
USING THE CHARTS TO NAVIGATE:
You want to cross a mile-wide channel to reach a particular point across the way. You realize that you will be crossing at mid high with a water depth of 11 feet, several feet above a submerged reef running parallel to shore. Winds are insignificant so the crossing should be without foreseeable incidence. However, because the channel narrows, there is a good chance that the currents may be running a little faster than midchannel thereby pushing your kayak slightly further up the bay than a direct course line might indicate.
One way to anticipate a course shift is to deliberately aim for one side or the other of your desired destination point. Instead of trying to be point-on at your location, deliberately aim slightly right or left. That way, once you reach the shore line you can then know to go left or right to the exact intended spot on shore.
Tide charts and navigation work hand in hand. A great reference for tidal and navigational information and use, check out the book Fundamentals of Kayak Navigation by David Burch. It's an excellent source of useful information.
Tide charts are considered a bible for any mariner along our coastlines. Knowing fundamental tidal characteristics and using the information on tidal charts makes one a safer paddler.
Safe paddling.
Tom Watson is an avid sea kayaker and freelance writer. He also posts articles and thoughts on his website www.wavetameradventures.com. He has written 2 books, "Kids Gone Paddlin" and"How to Think Like A Survivor" that are available on Amazon.com.
Related Articles

How many of you have ever heard that paddle craft (vessels under oars according to the Navigation Rules)…

Even though they are flipping over, missing their gates and failing their maneuvers, they still look…

Driving a car safely involves much more than merely focusing only as far ahead as the taillights of…

The following is a modified excerpt from Ken Whiting's book, 'The Ultimate Guide to Whitewater…